Pie Chart vs. Bar Graph: Which One Should You Use?
By Kristoff
November 10, 2025
It's the most classic debate in data visualization: pie chart versus bar graph. Both are used to display data, but they tell fundamentally different stories. Choosing the wrong one is one of the most common mistakes in reporting, leading to confusion and misinterpretation. So, how do you decide?
The debate ends here. This guide will provide you with one simple, powerful rule that will make the choice clear every single time. We'll even visualize the same data side-by-side to show you why this rule is so critical.
The Golden Rule: Composition vs. Comparison
Here is the only rule you need to remember:
- Use a Pie Chart when your goal is to show Composition (the parts of a single whole).
- Use a Bar Graph when your goal is to Compare independent values.
That's it. If your message is "Here is how our total sales broke down by region," you are talking about composition (a pie chart might work). If your message is "Here is how our sales in each region performed against each other," you are talking about comparison (a bar graph is the best choice).
The Ultimate Test: Visualizing the Same Data
Let's prove the golden rule with an example. Imagine we have data on website traffic sources where the percentages are relatively close.
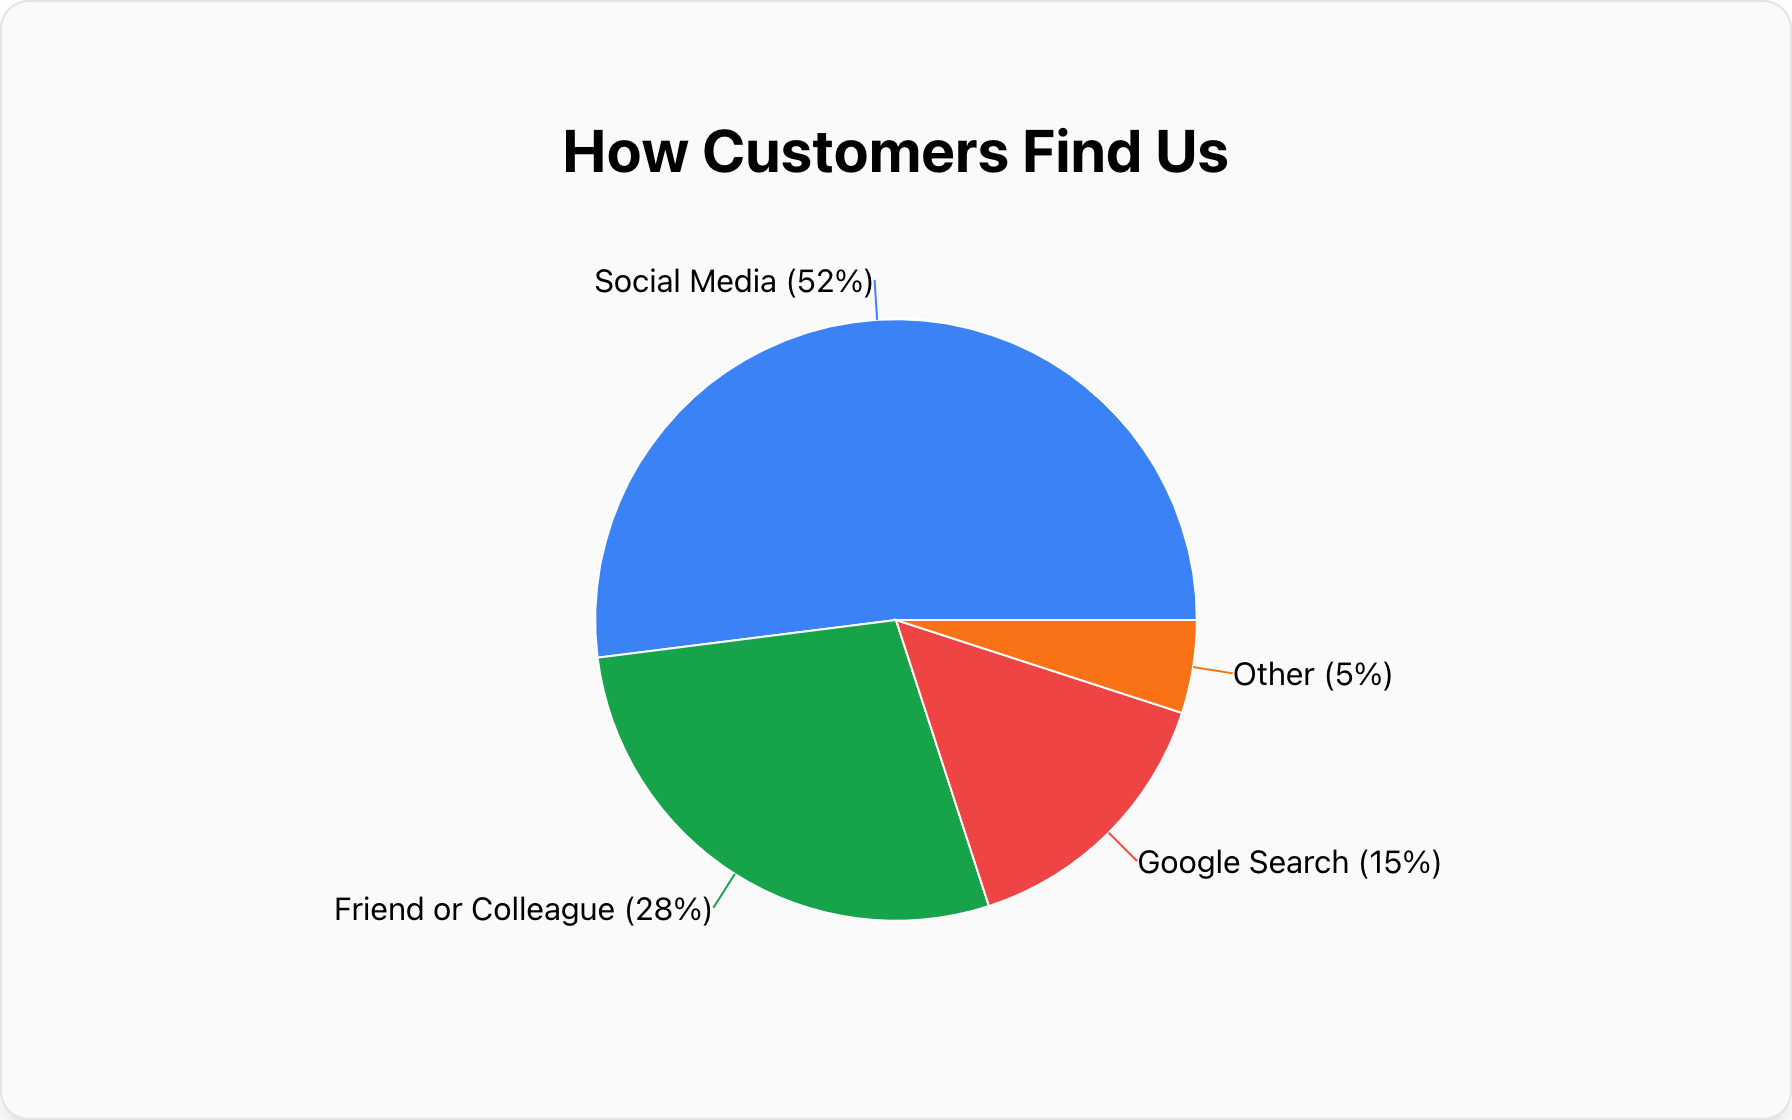
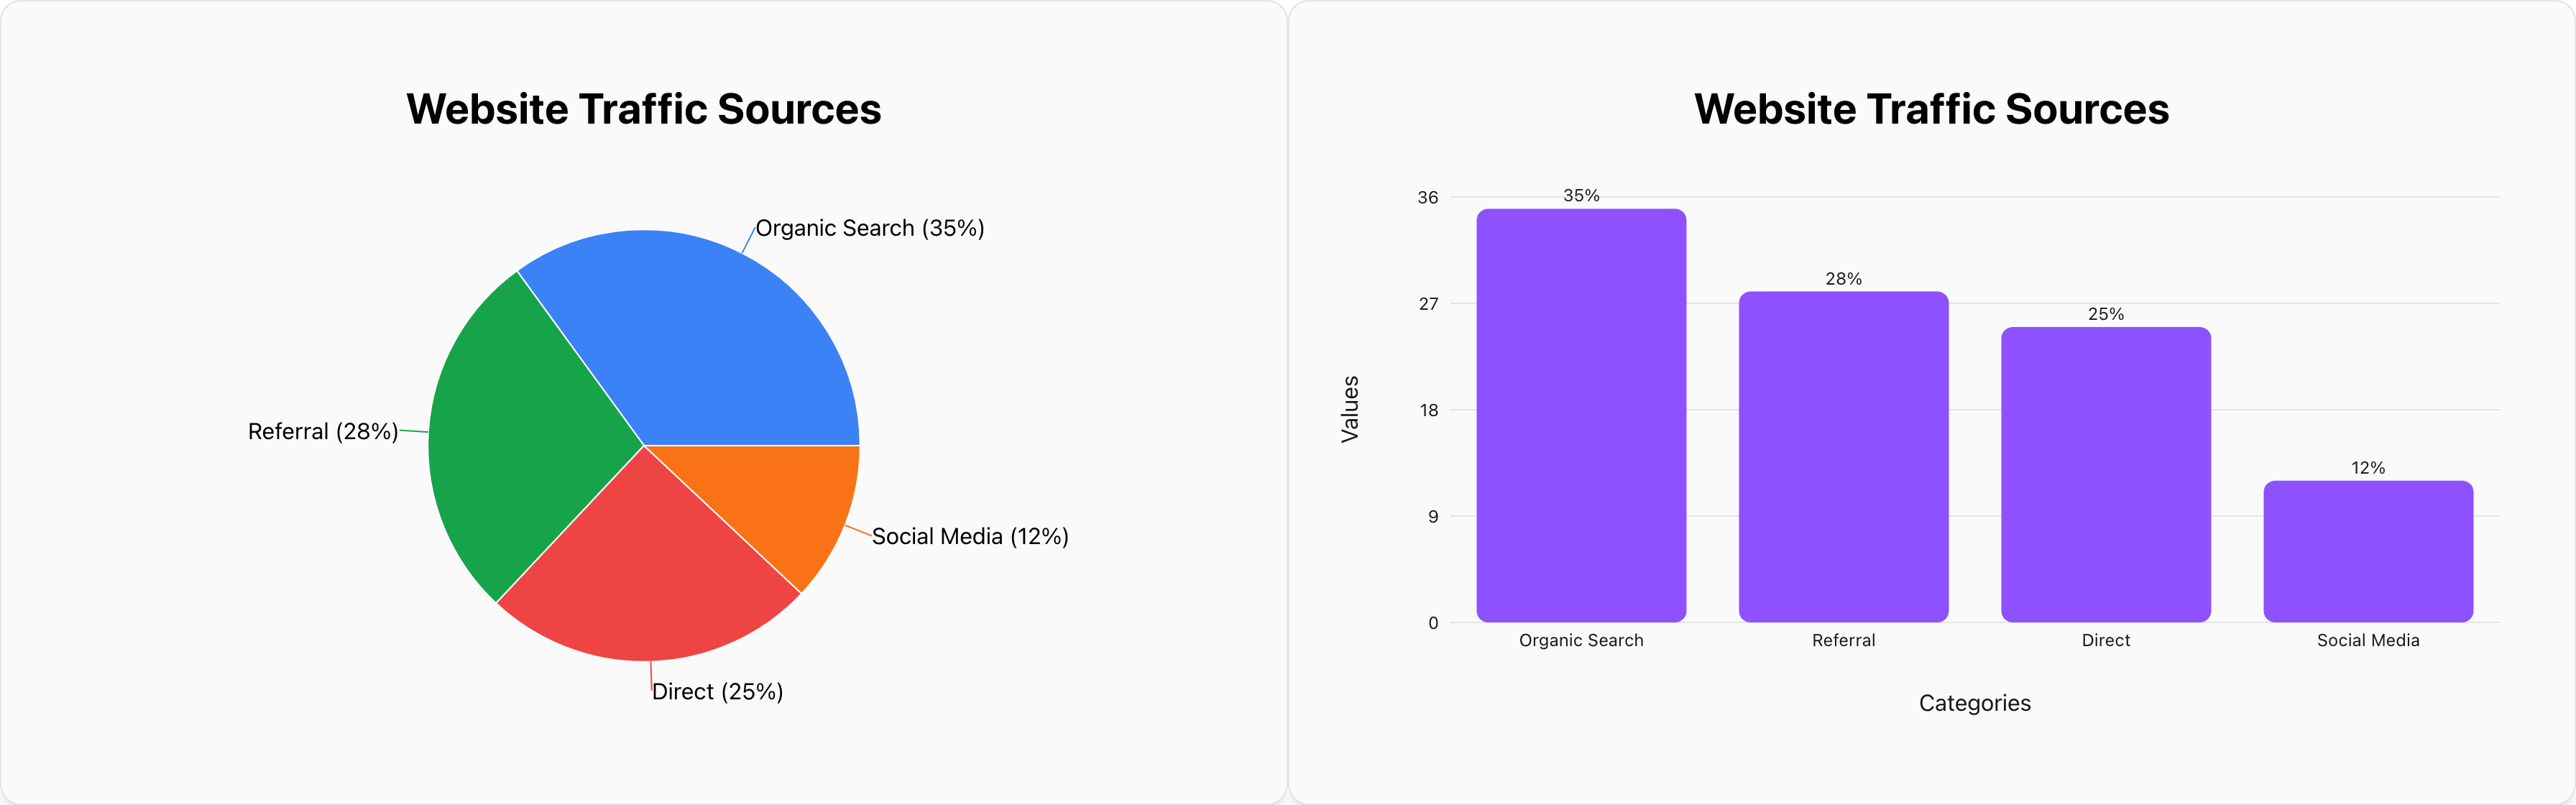
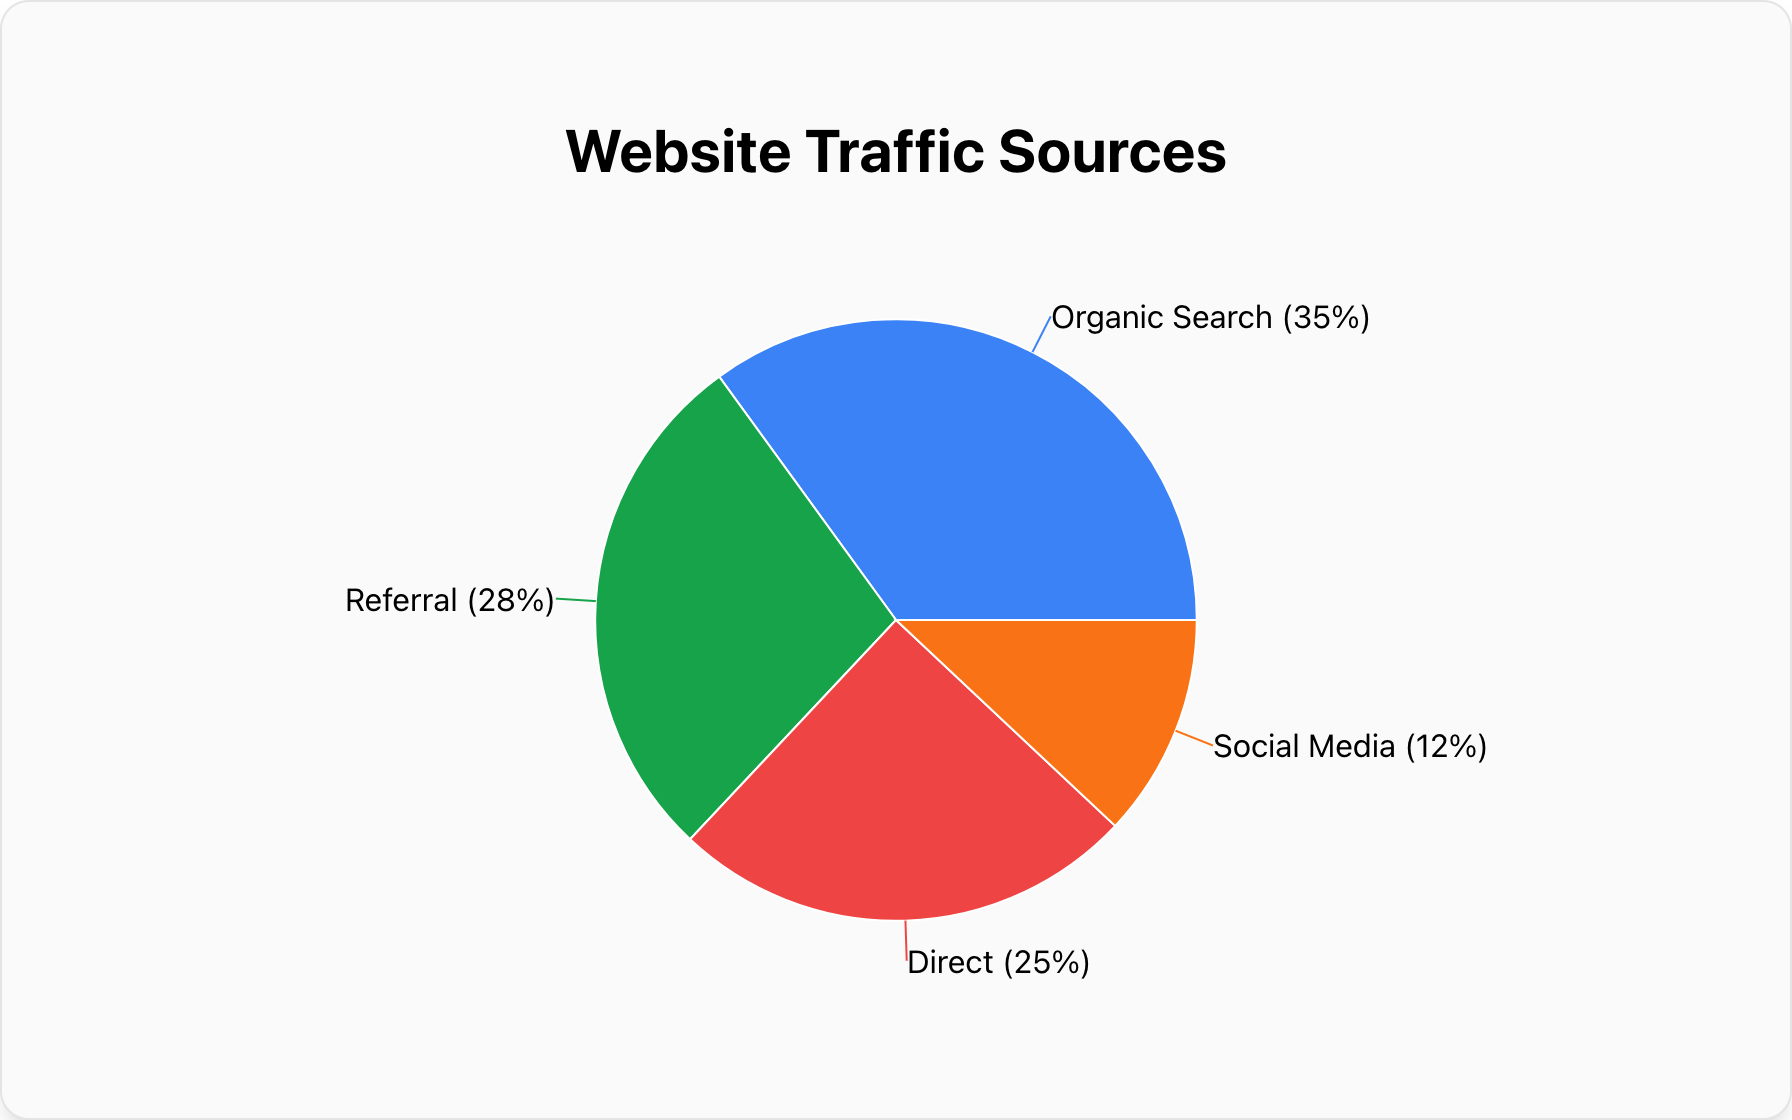
As a Pie Chart: Difficult to Compare
Look at the pie chart below. Can you instantly tell if "Referral" traffic is higher or lower than "Direct" traffic? It's difficult. Our brains are not wired to accurately compare angles, so we have to rely on reading the labels, which defeats the purpose of a visual.
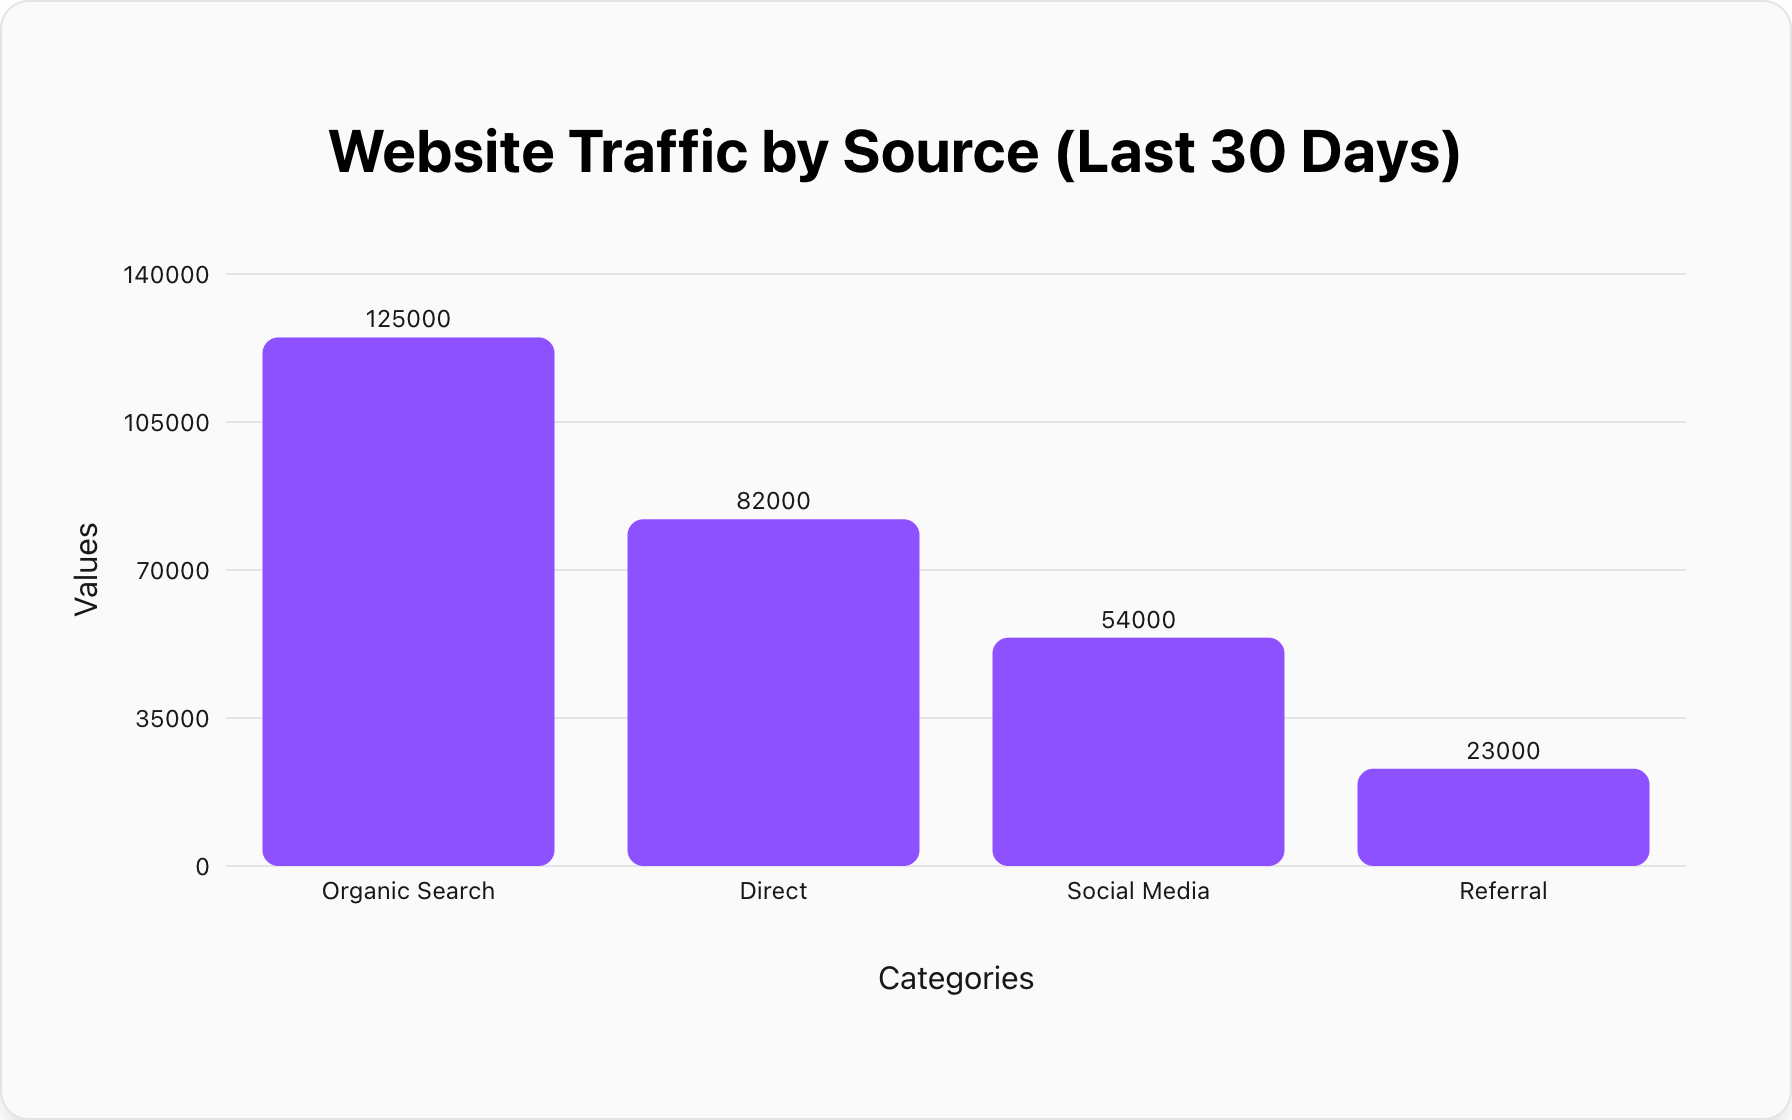
As a Bar Graph: Instantly Clear
Now look at the exact same data in a bar graph. The ranking is instantly obvious. You can see at a glance that "Referral" is higher than "Direct", and "Organic Search" is the clear winner. The comparison is effortless and precise because we are comparing lengths on a common baseline.
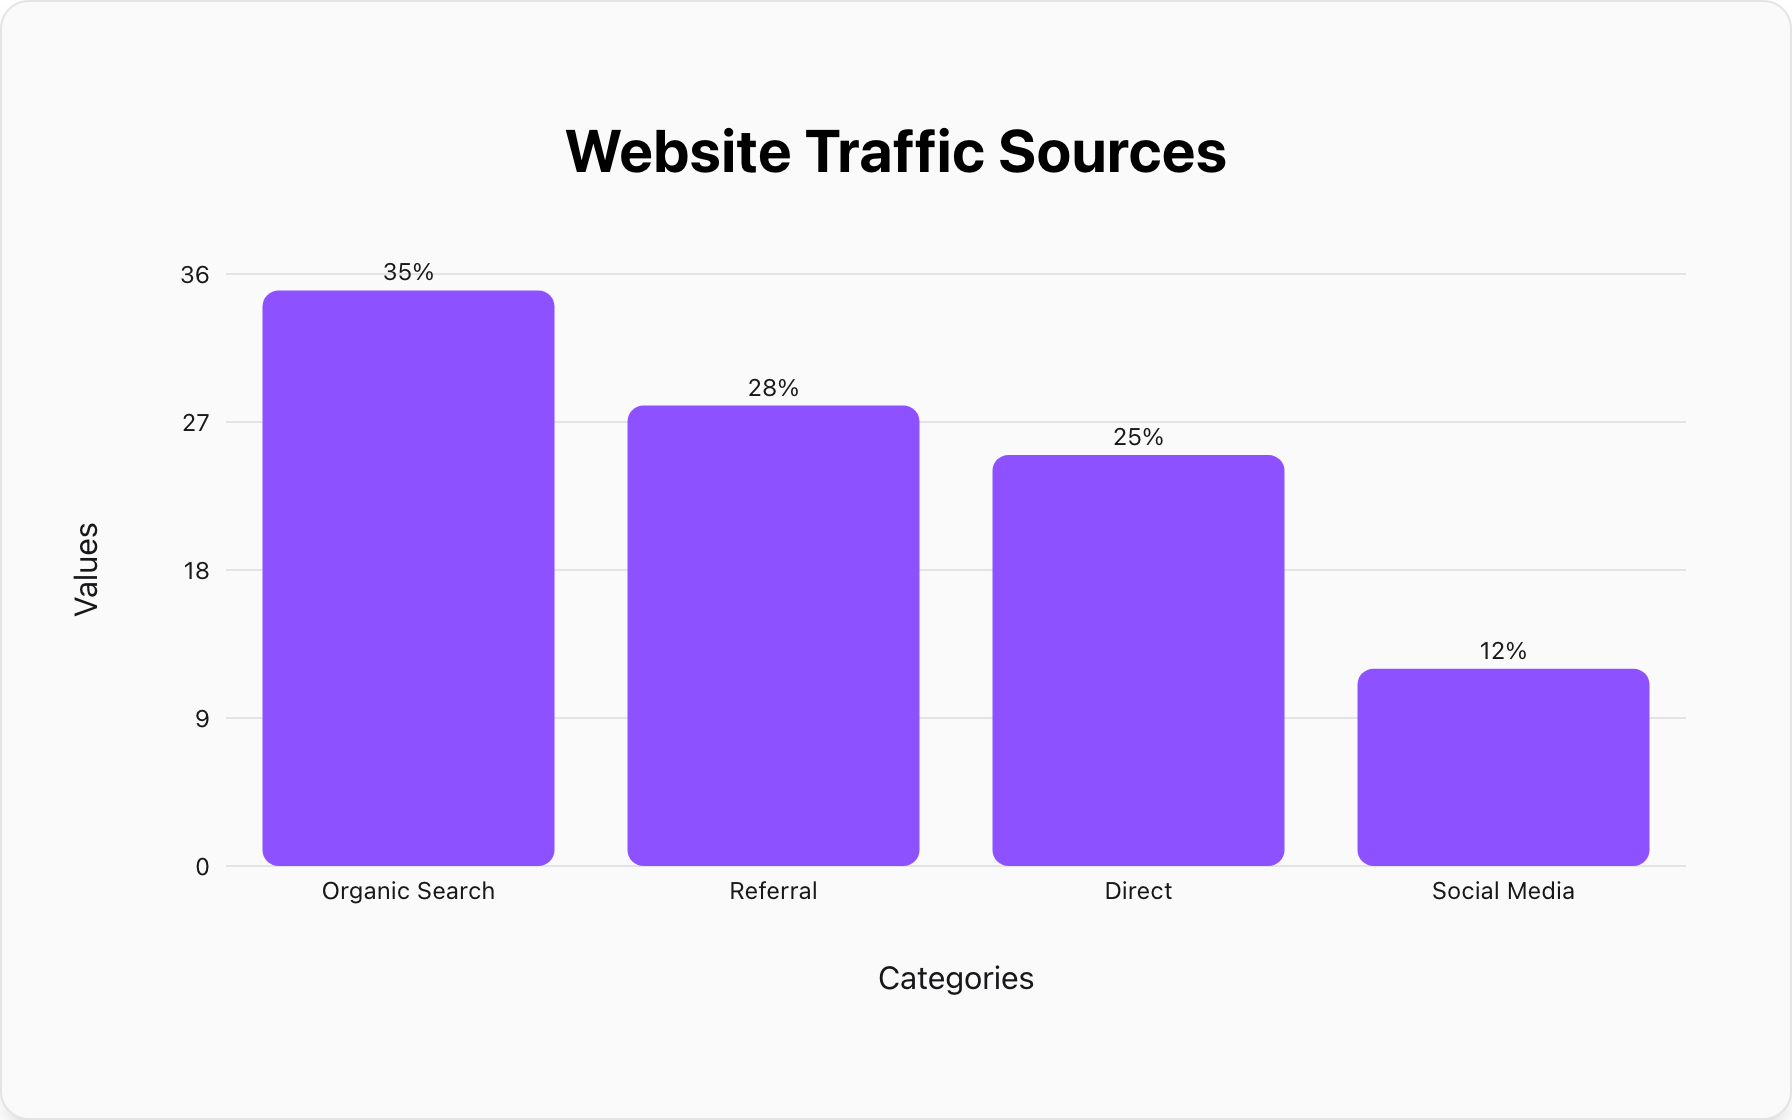
Data used for both charts:
Chart "Website Traffic Sources"
Organic Search, 35%
Referral, 28%
Direct, 25%
Social Media, 12%
Quick Decision Table
| Use a Pie Chart When... | Use a Bar Graph When... |
|---|---|
| You are showing parts of a whole (composition). | You are comparing values across categories. |
| All values must add up to 100%. | Values are independent and don't need to total 100%. |
| You have 5 or fewer categories. | You have many categories to compare. |
| Exact values are less important than the general proportion. | Precise comparison between categories is critical. |
For a deeper dive into each chart's specific rules and advanced uses, explore our complete guide to pie charts and our ultimate guide to bar graphs.
Conclusion: Choose the Chart that Fits Your Story
The choice between a pie chart and a bar graph isn't about which one looks better—it's about which one tells the truth of your data more clearly. By remembering the golden rule of **Composition vs. Comparison**, you will always select the right tool for the job.
When in doubt, a bar graph is almost always a safer and clearer choice. But when you have a simple story of proportions to tell, a well-made pie chart can be the perfect fit.
Popular Blogs